Matplotlib
Here we will walk through a few things that you can do to change the aesthetics of your plots in Matplotlib.
Prep
Let us first import our libraries:
import numpy as np
import matplotlib.pyplot as plt
Next we will create our data:
t = np.linspace(0,5,2000)
x = np.exp(-0.8*t)*np.sin(10*t)
y = np.exp(-0.6*t)*np.sin(20*t)
Base Plot
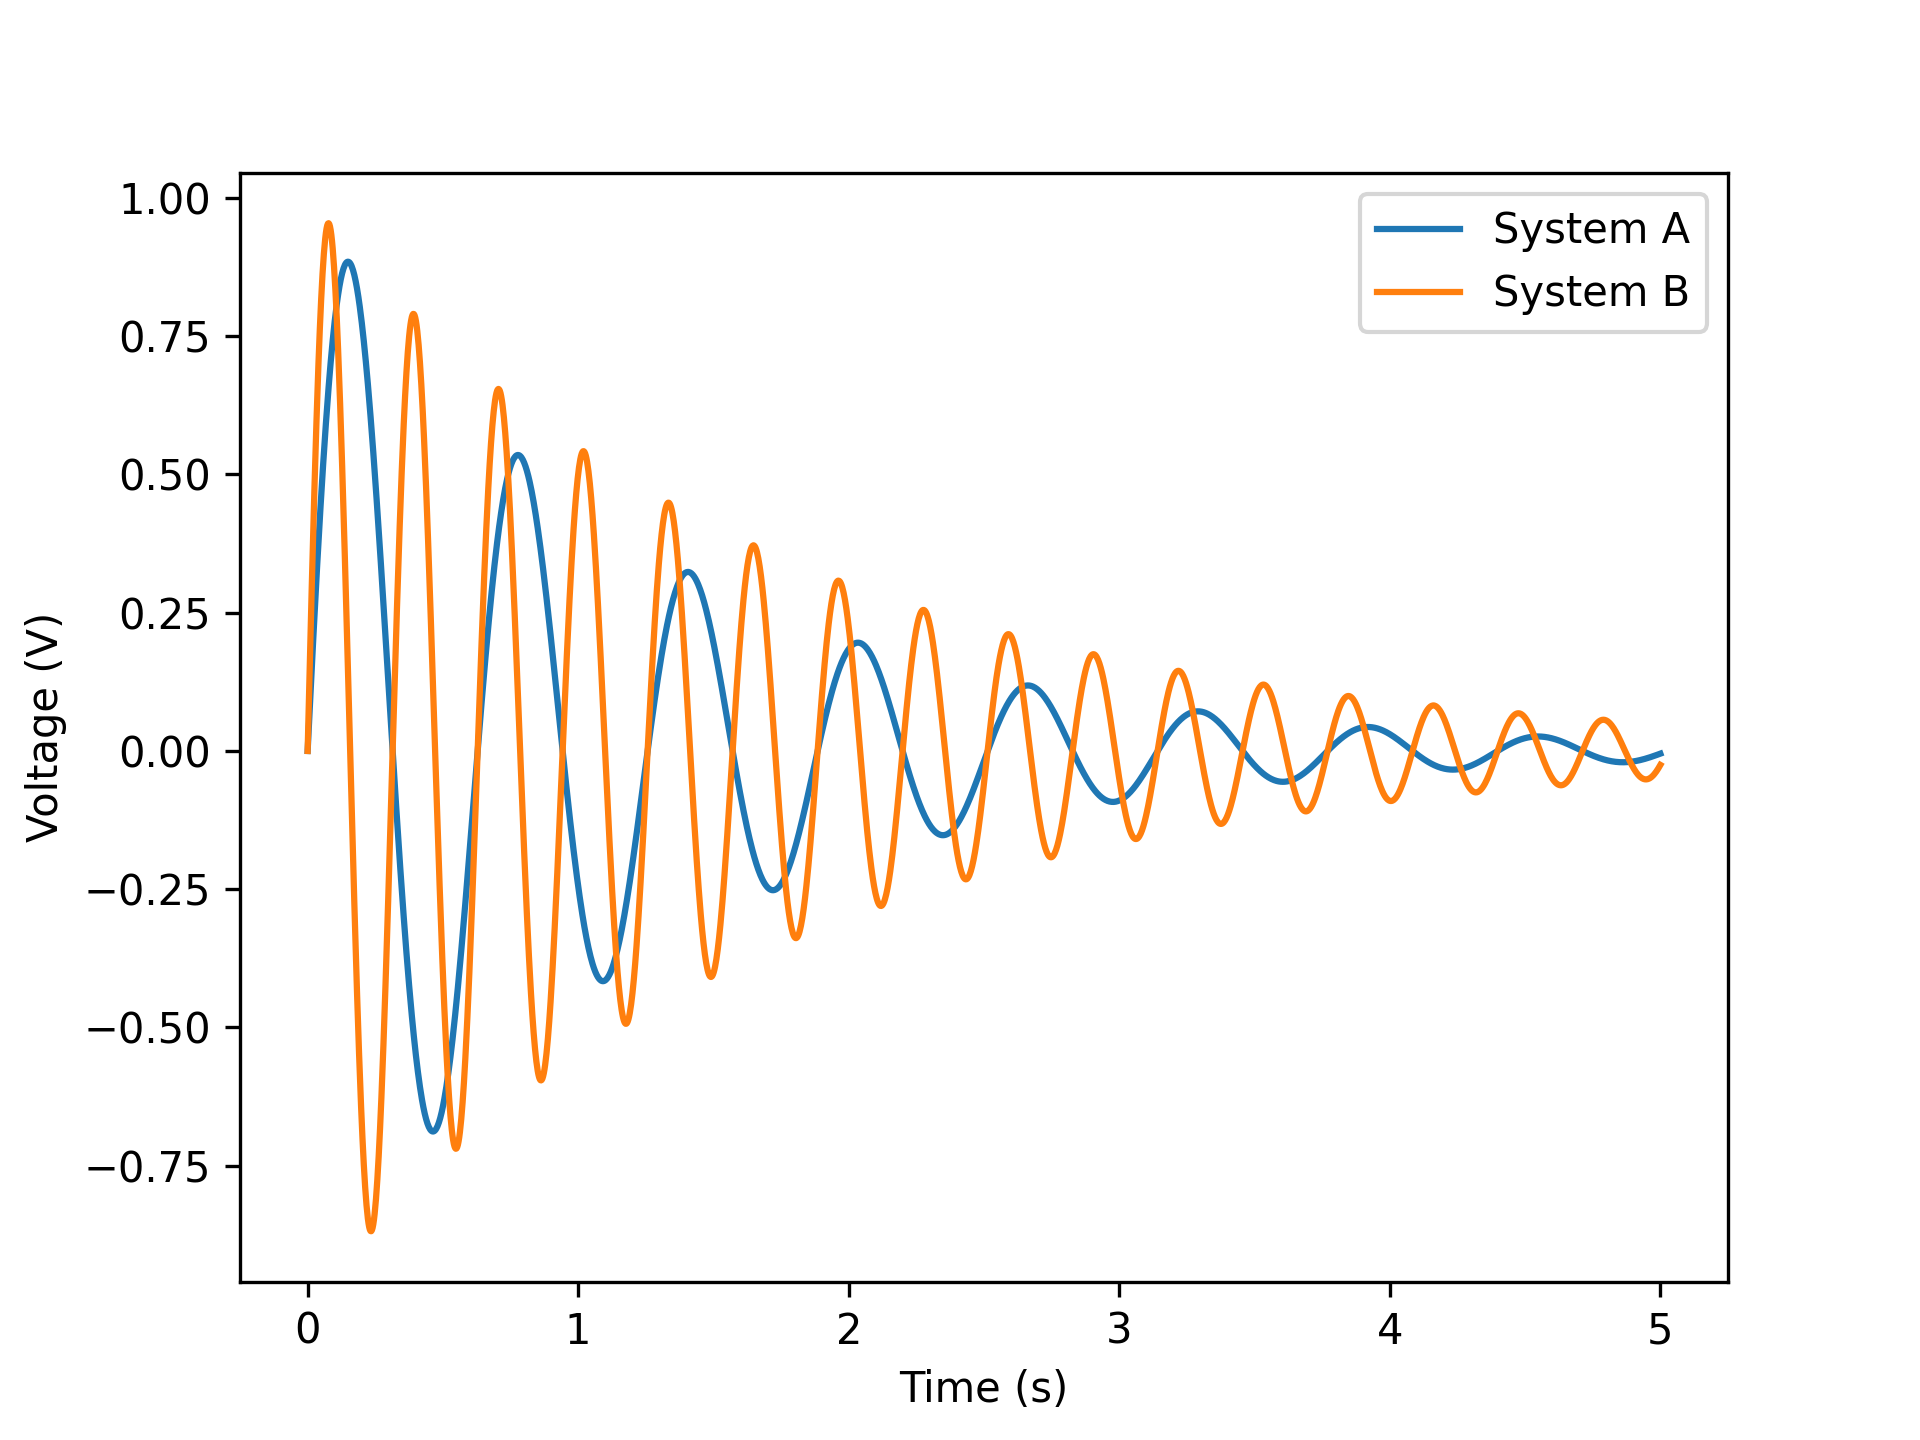
If one does a simple plot, it will look something like this:
fig, ax = plt.subplots(dpi=300)
ax.plot(t,x, label="System A")
ax.plot(t,y, label="System B")
ax.set_xlabel("Time (s)")
ax.set_ylabel("Voltage (V)")
ax.legend()
fig.savefig("step1.png")
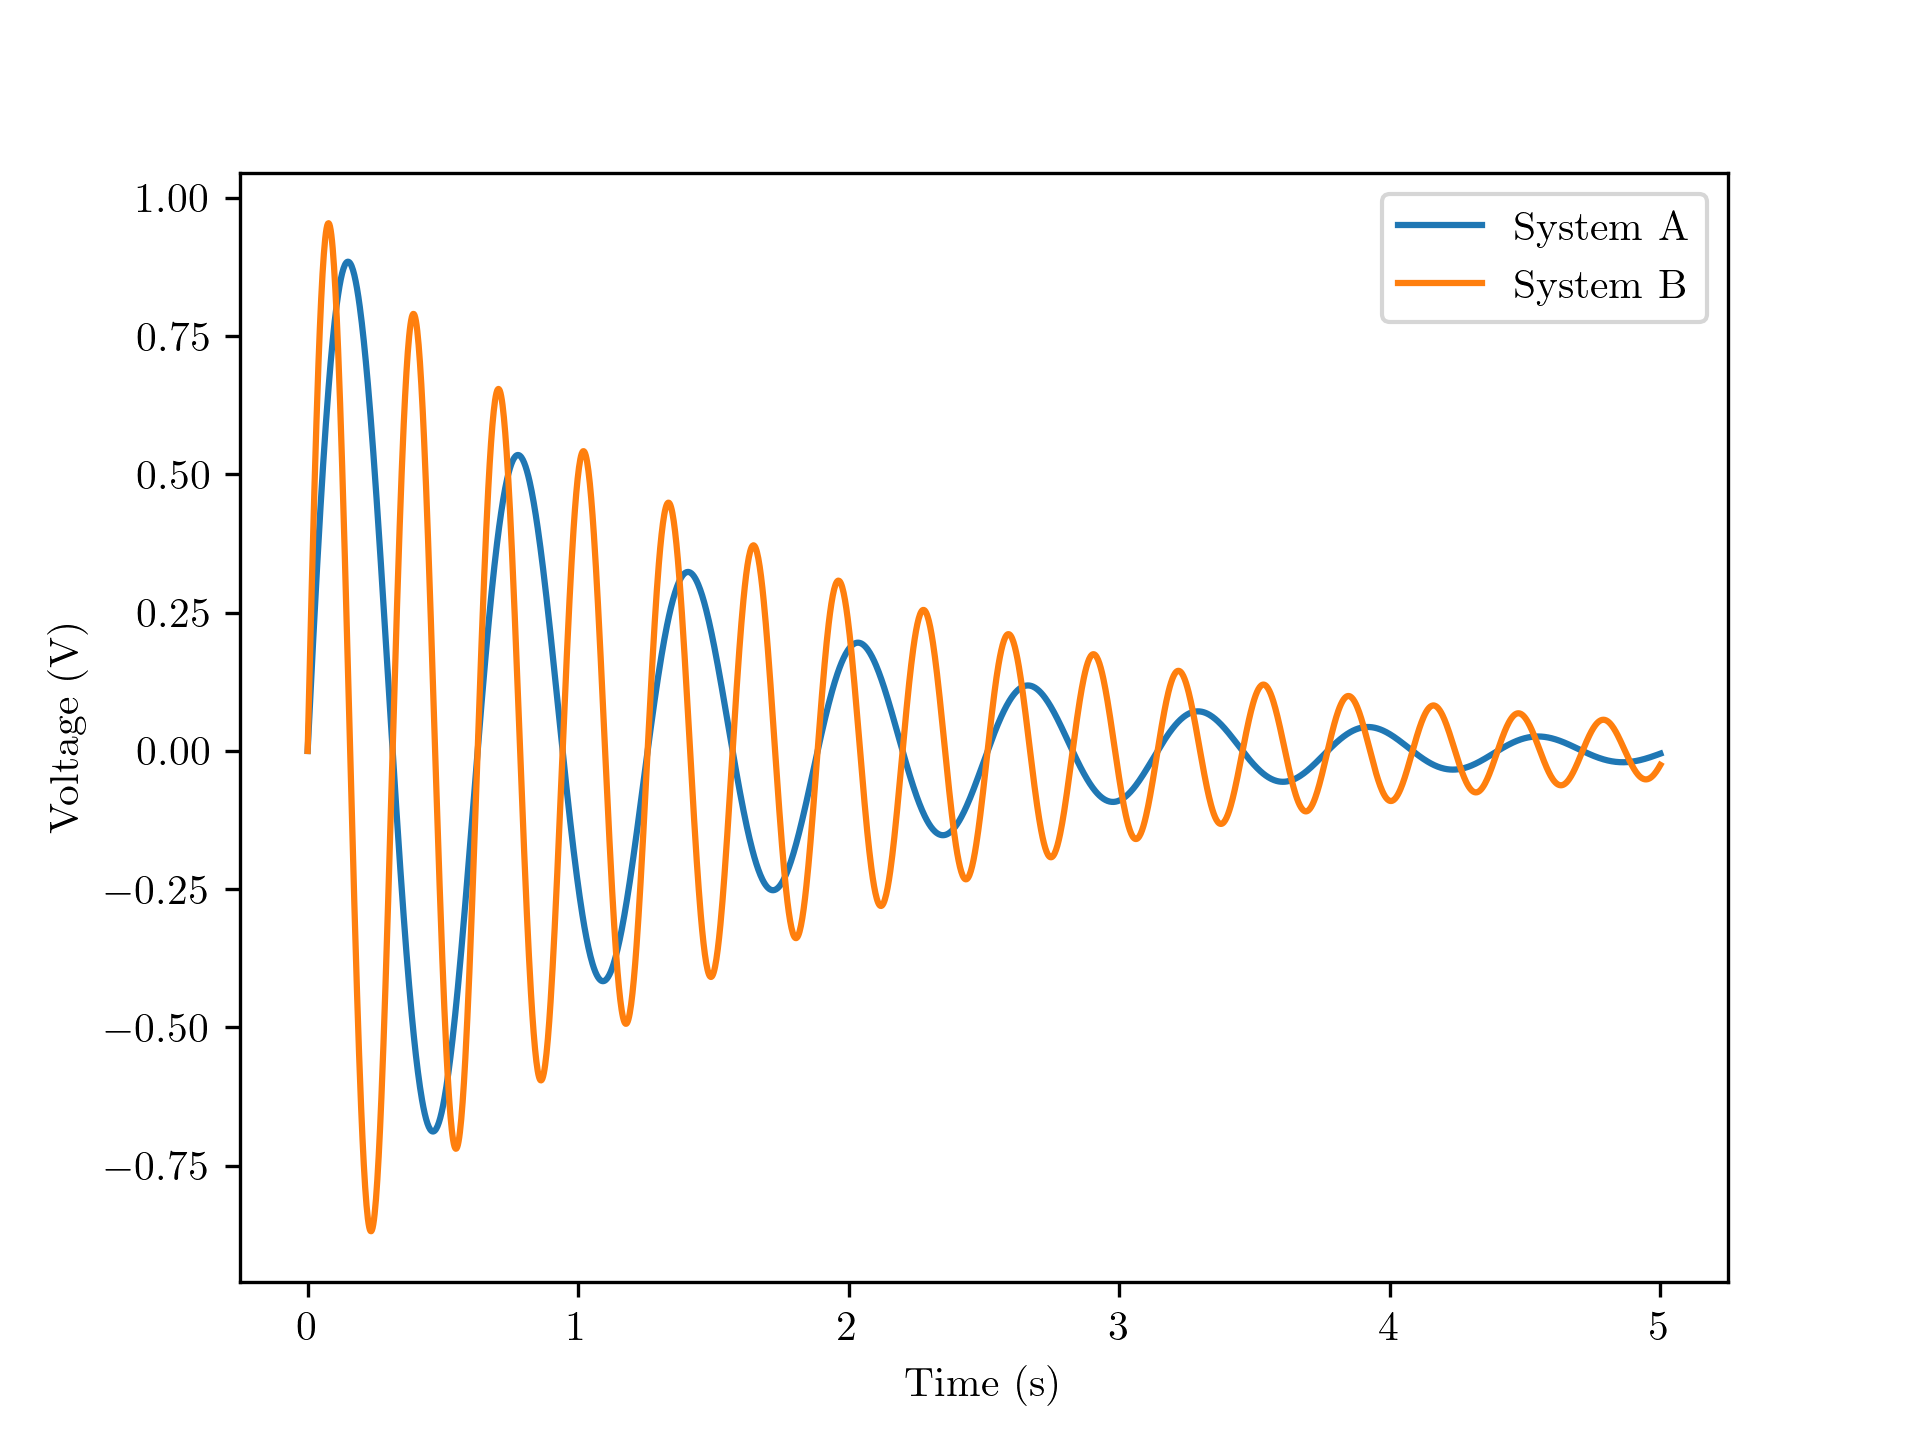
Changing the Text
Text can always be improved, usually by changing the fonts. In order to do so, update the rcParams. For these, you should change the following parameters:
text.usetex: in order to use LaTeXfont.family: in order to use the Serif familyfont.serif: to determine the type of serif you wish to use
import matplotlib as mpl

nice_fonts = {
    "text.usetex": True,
    "font.family": "serif",
    "font.serif" : "Times New Roman",
}
mpl.rcParams.update(nice_fonts)

# ======== Same as before =========
if True:
    fig, ax = plt.subplots(dpi=300)
    ax.plot(t,x, label="System A")
    ax.plot(t,y, label="System B")
    ax.set_xlabel("Time (s)")
    ax.set_ylabel("Voltage (V)")
    ax.legend()
    fig.savefig("step2.png")
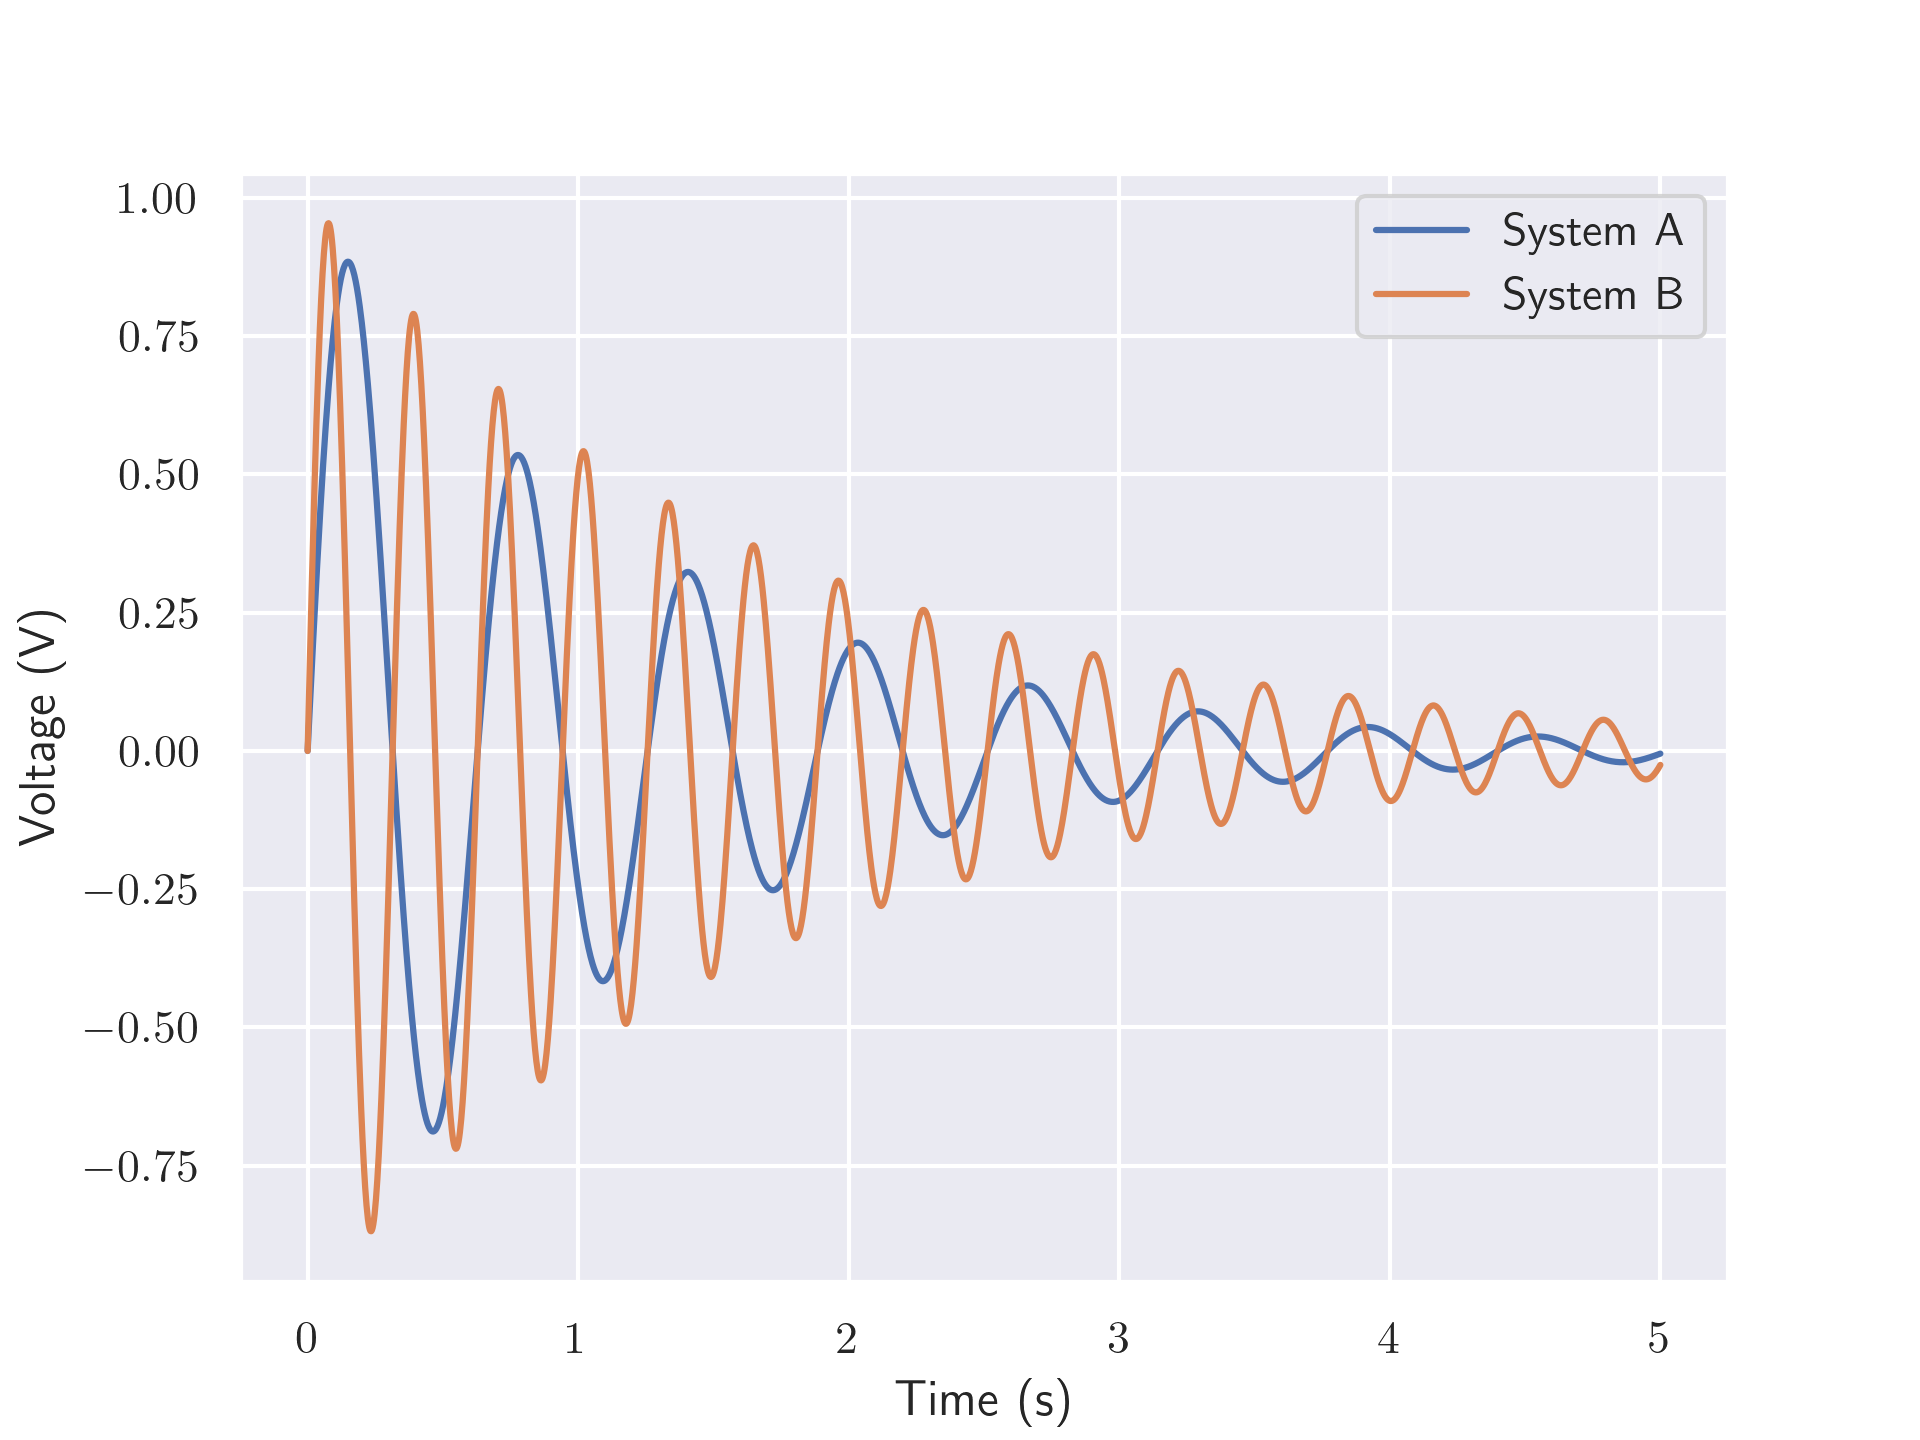
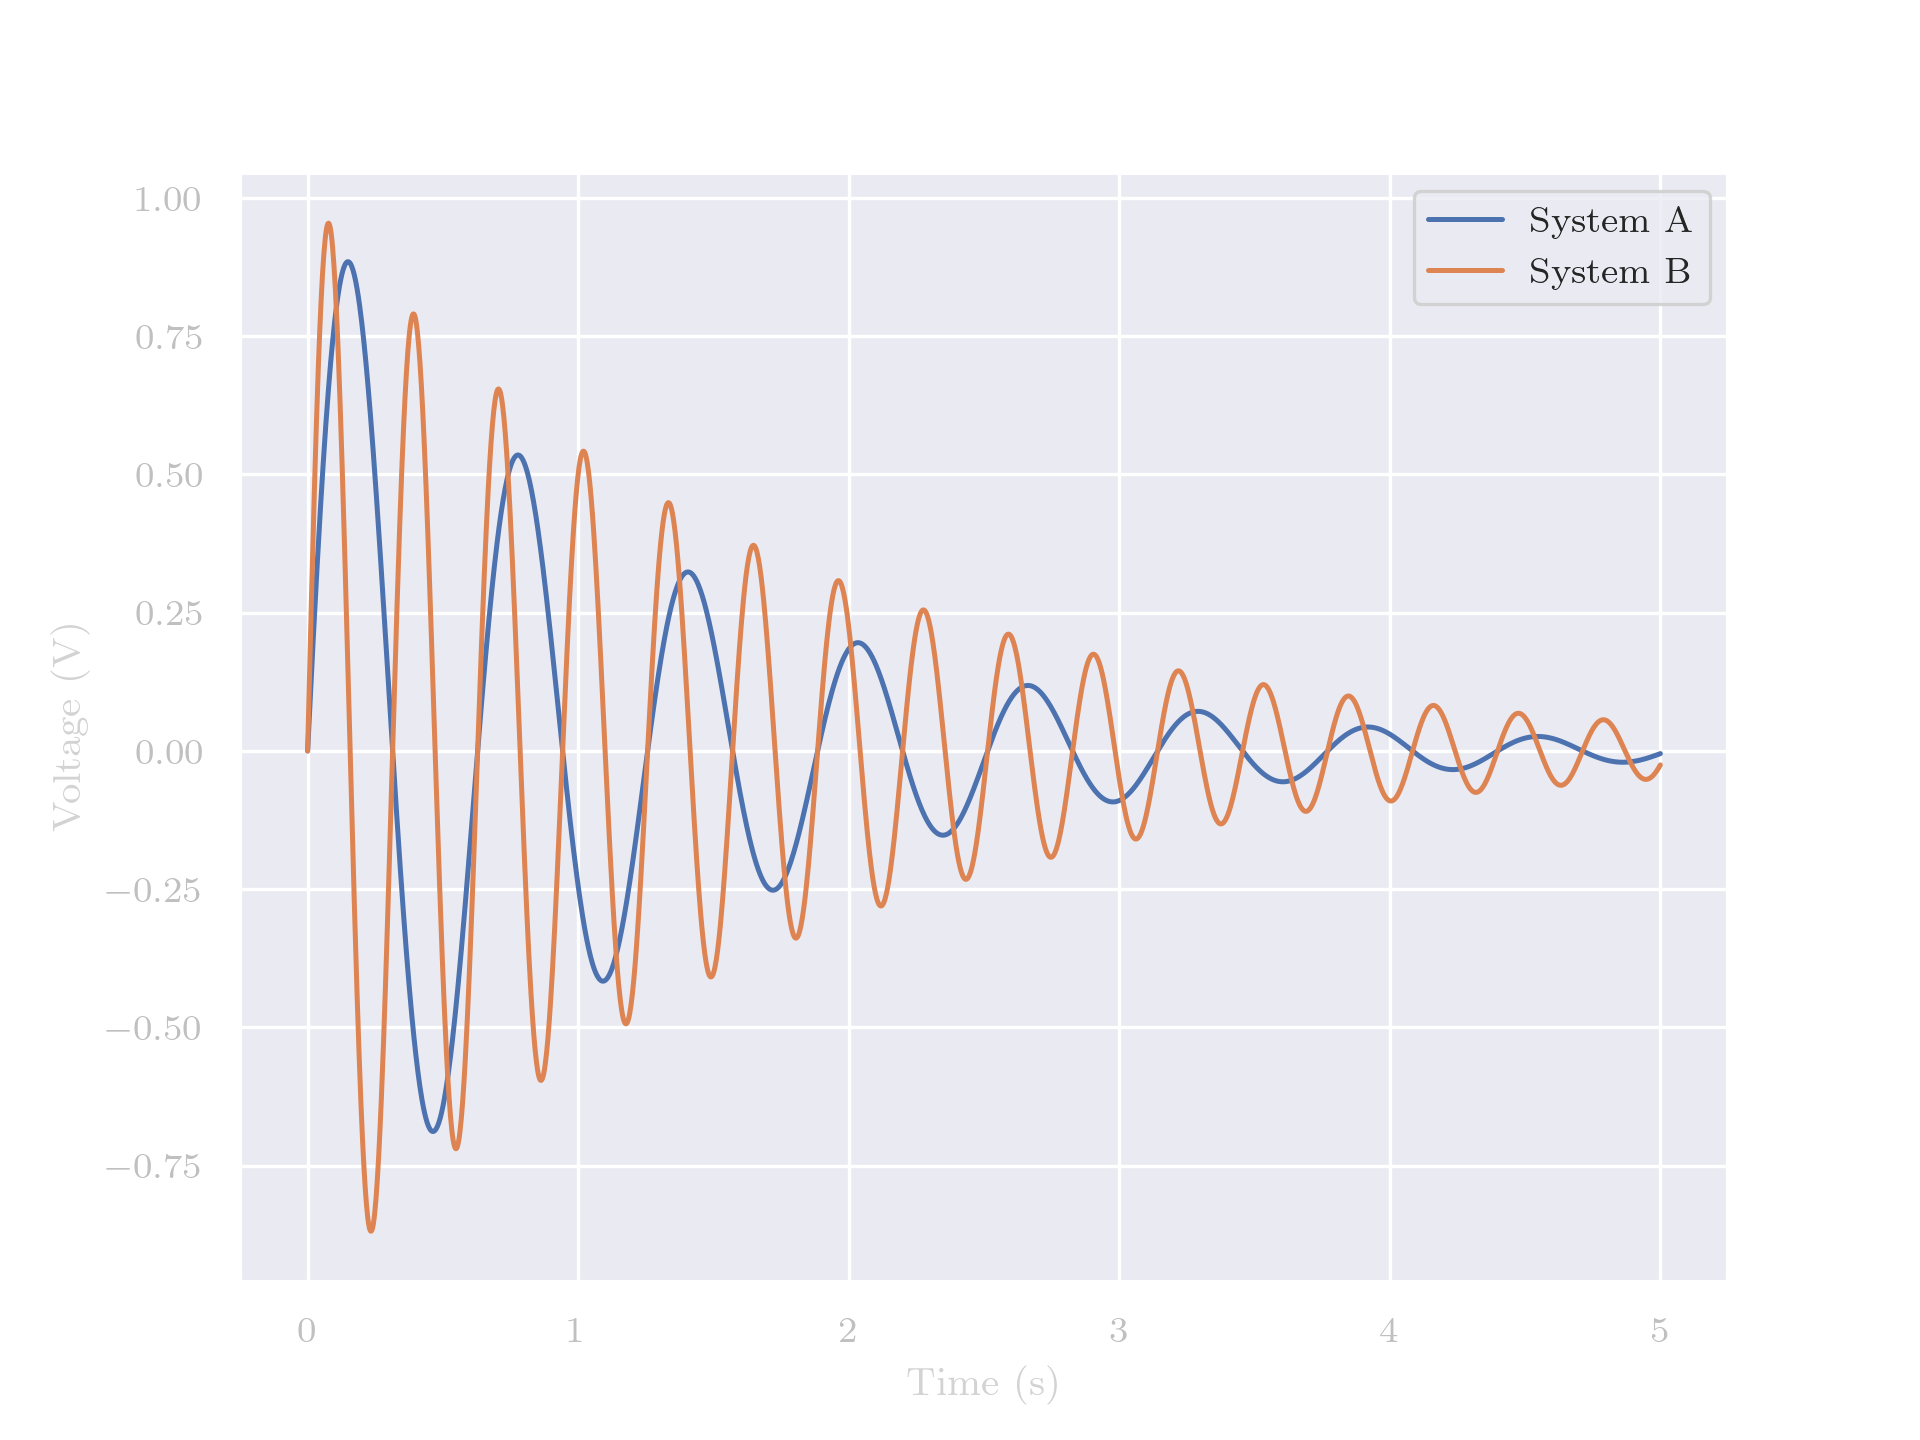
Applying the Seaborn Theme
import seaborn as sns
sns.set_theme()
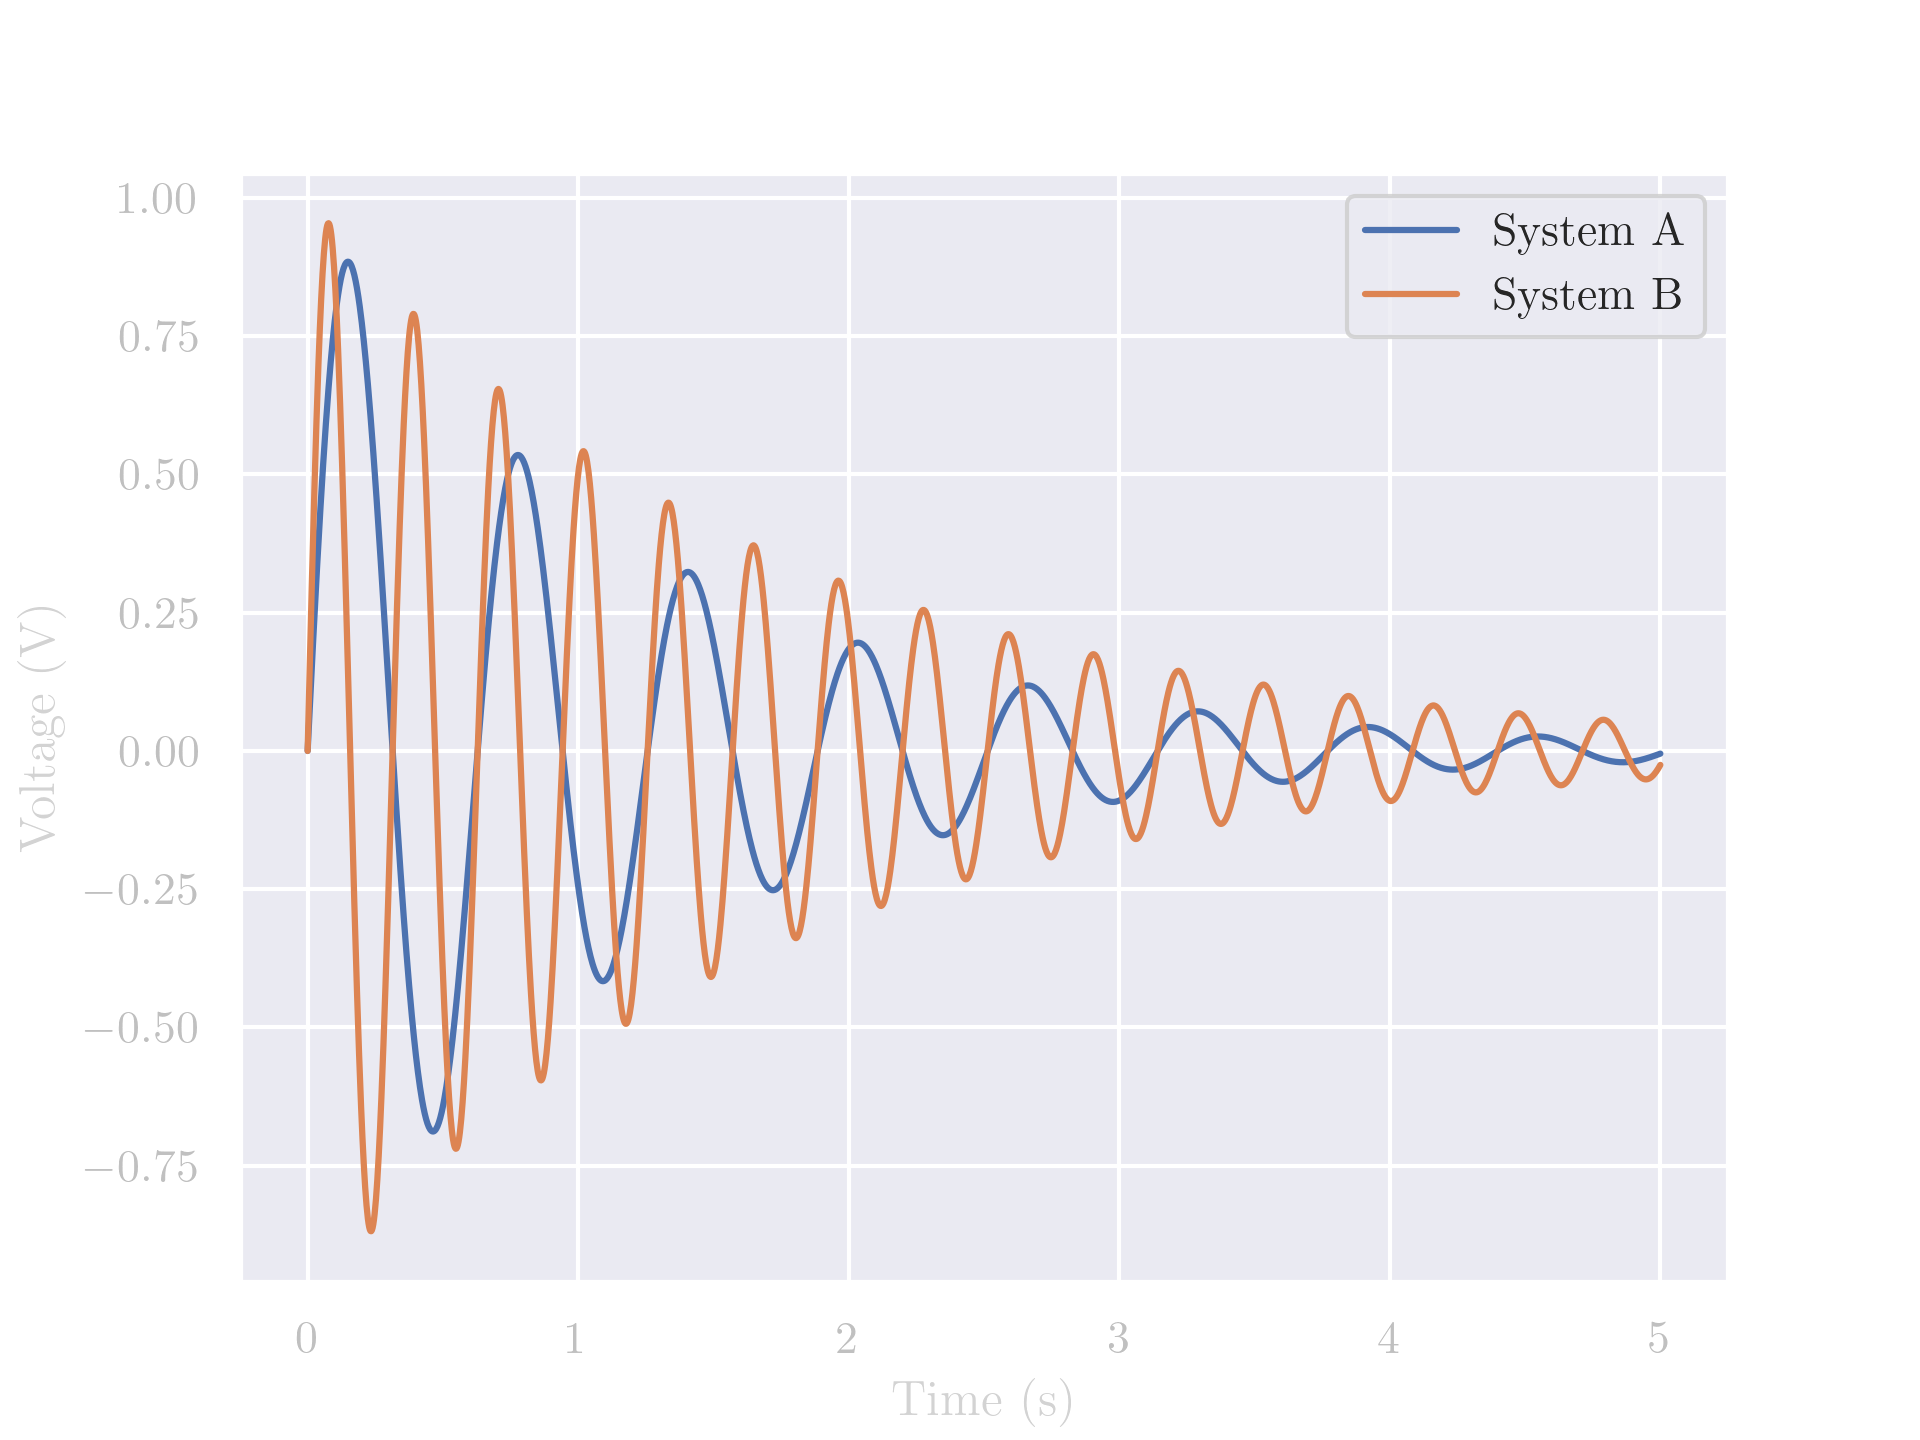
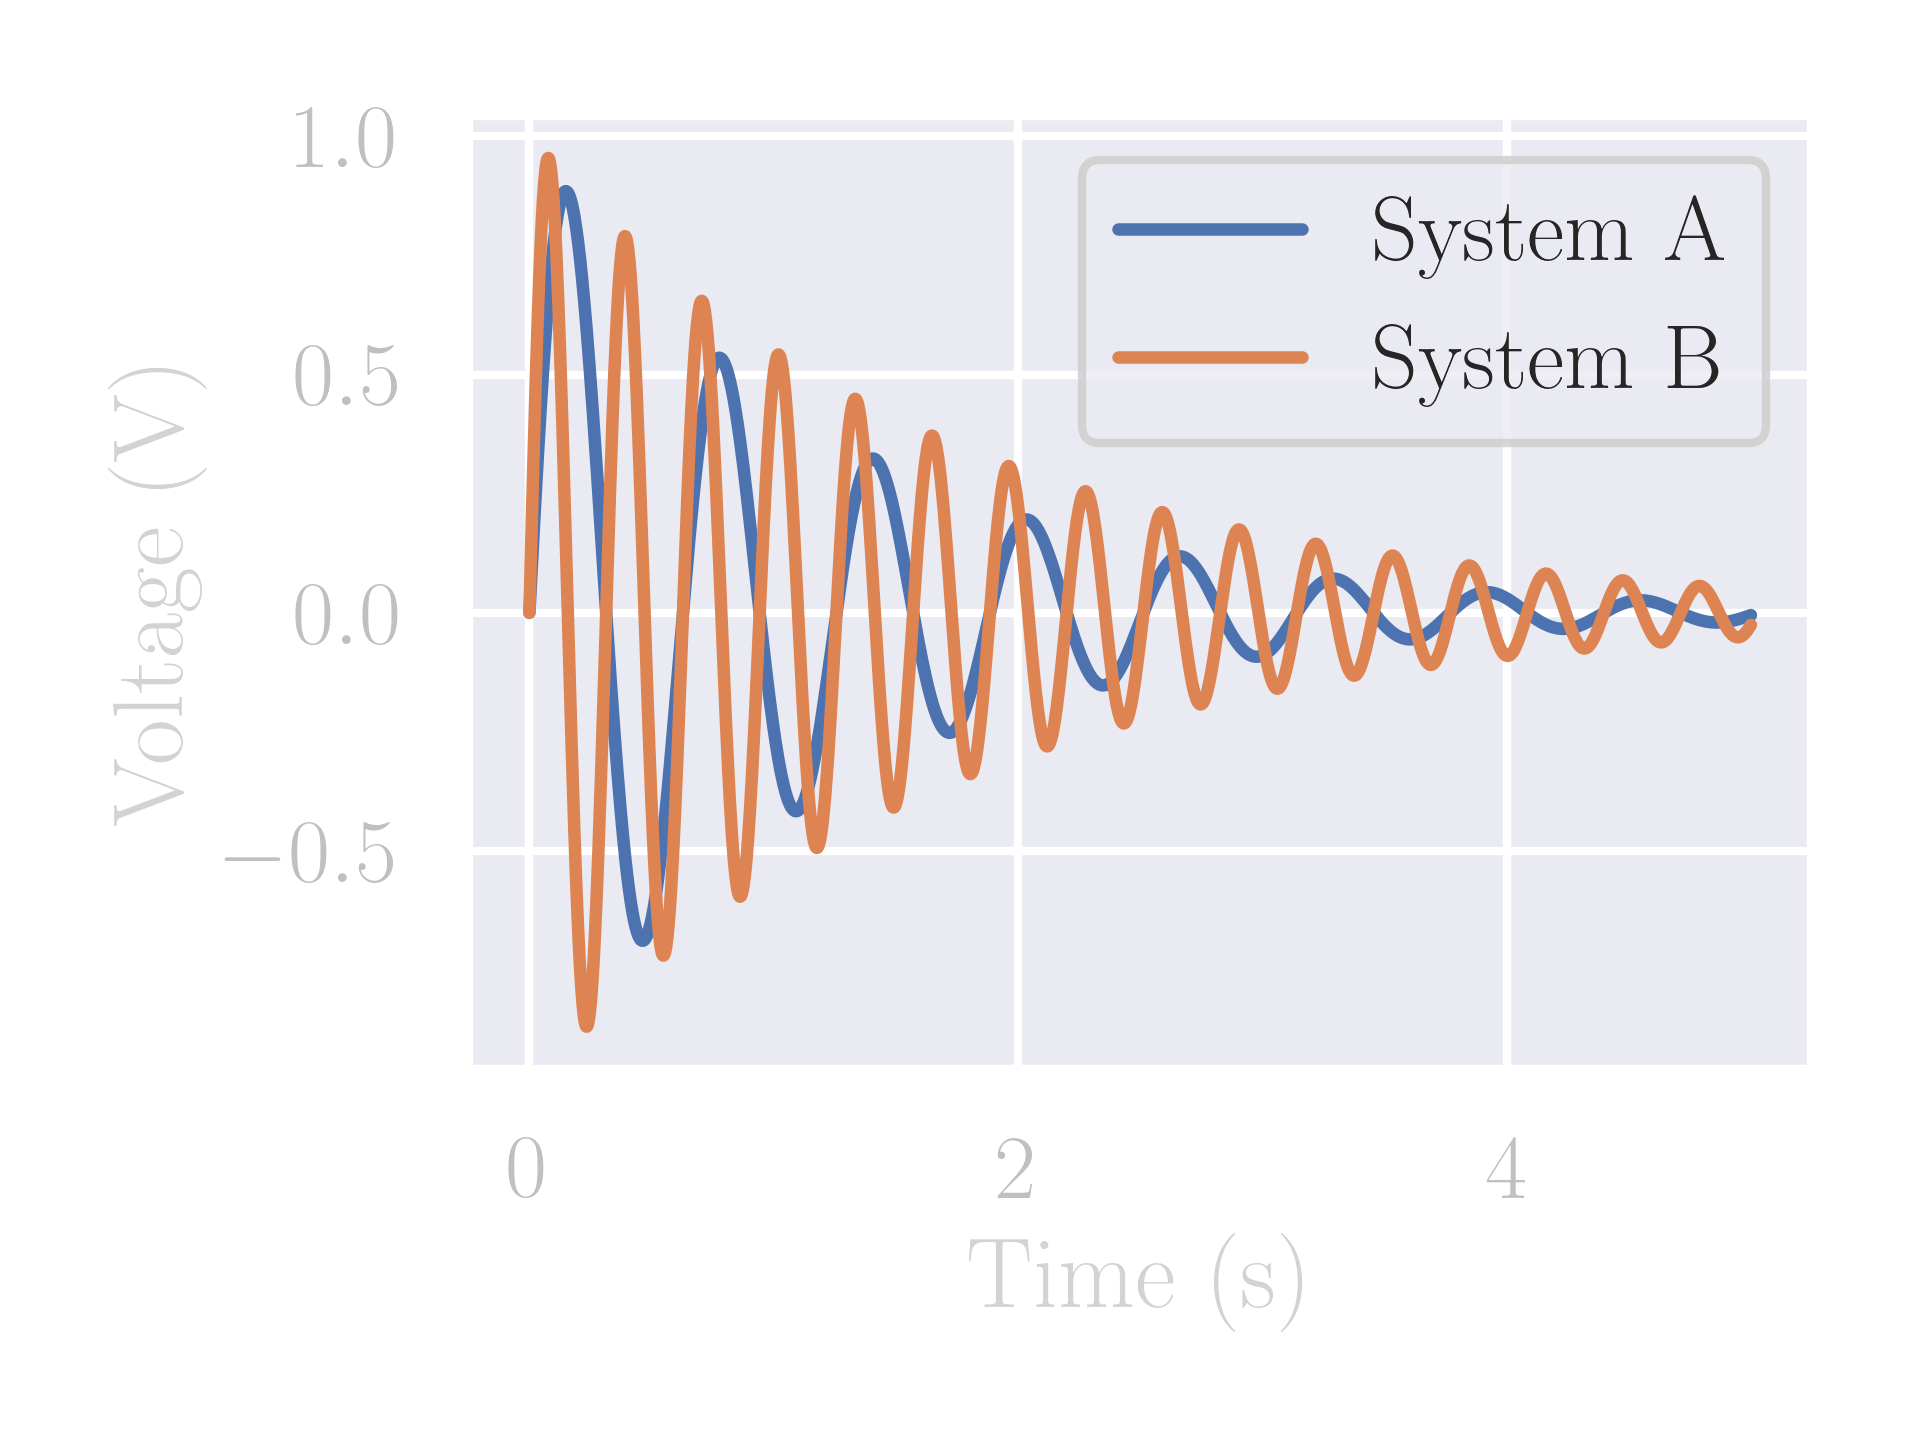
Changing the Tick Colors and Transparent Background
In order to change the color of the axes and of the ticks, you should change the rcParams by modifying the following parameters:
axes.labelcolorytick.colorxtick.color
Additionally, this is a good point to make the background transparent. Usually, you can simply save the figure with fig.savefig and pass in the parameter transparent=True. However, that doesn’t work for figures that have been themed like with Seaborn. For those, usually, there are patches that make up the background. In such case, you need to pass in the parameter facecolor="none".
sns.set_theme()
nice_fonts = {
    "text.usetex": True,
    "font.family": "serif",
    "font.serif" : "Times New Roman",
    "axes.labelcolor": "lightgray",         # NEW
    "ytick.color" : "silver",               # NEW
    "xtick.color" : "silver",               # NEW
}
mpl.rcParams.update(nice_fonts)
fig, ax = plt.subplots(dpi=300)
ax.plot(t,x, label="System A")
ax.plot(t,y, label="System B")
ax.set_xlabel("Time (s)")
ax.set_ylabel("Voltage (V)")
ax.legend()
fig.savefig("step4.png",facecolor="none")   # NEW
Contexts
You can also set contexts for your figures. Here we show the examples for “talk” and for “paper”. In this case, this uses the command
sns.set_context("paper")
Whereas this uses
sns.set_context("talk")
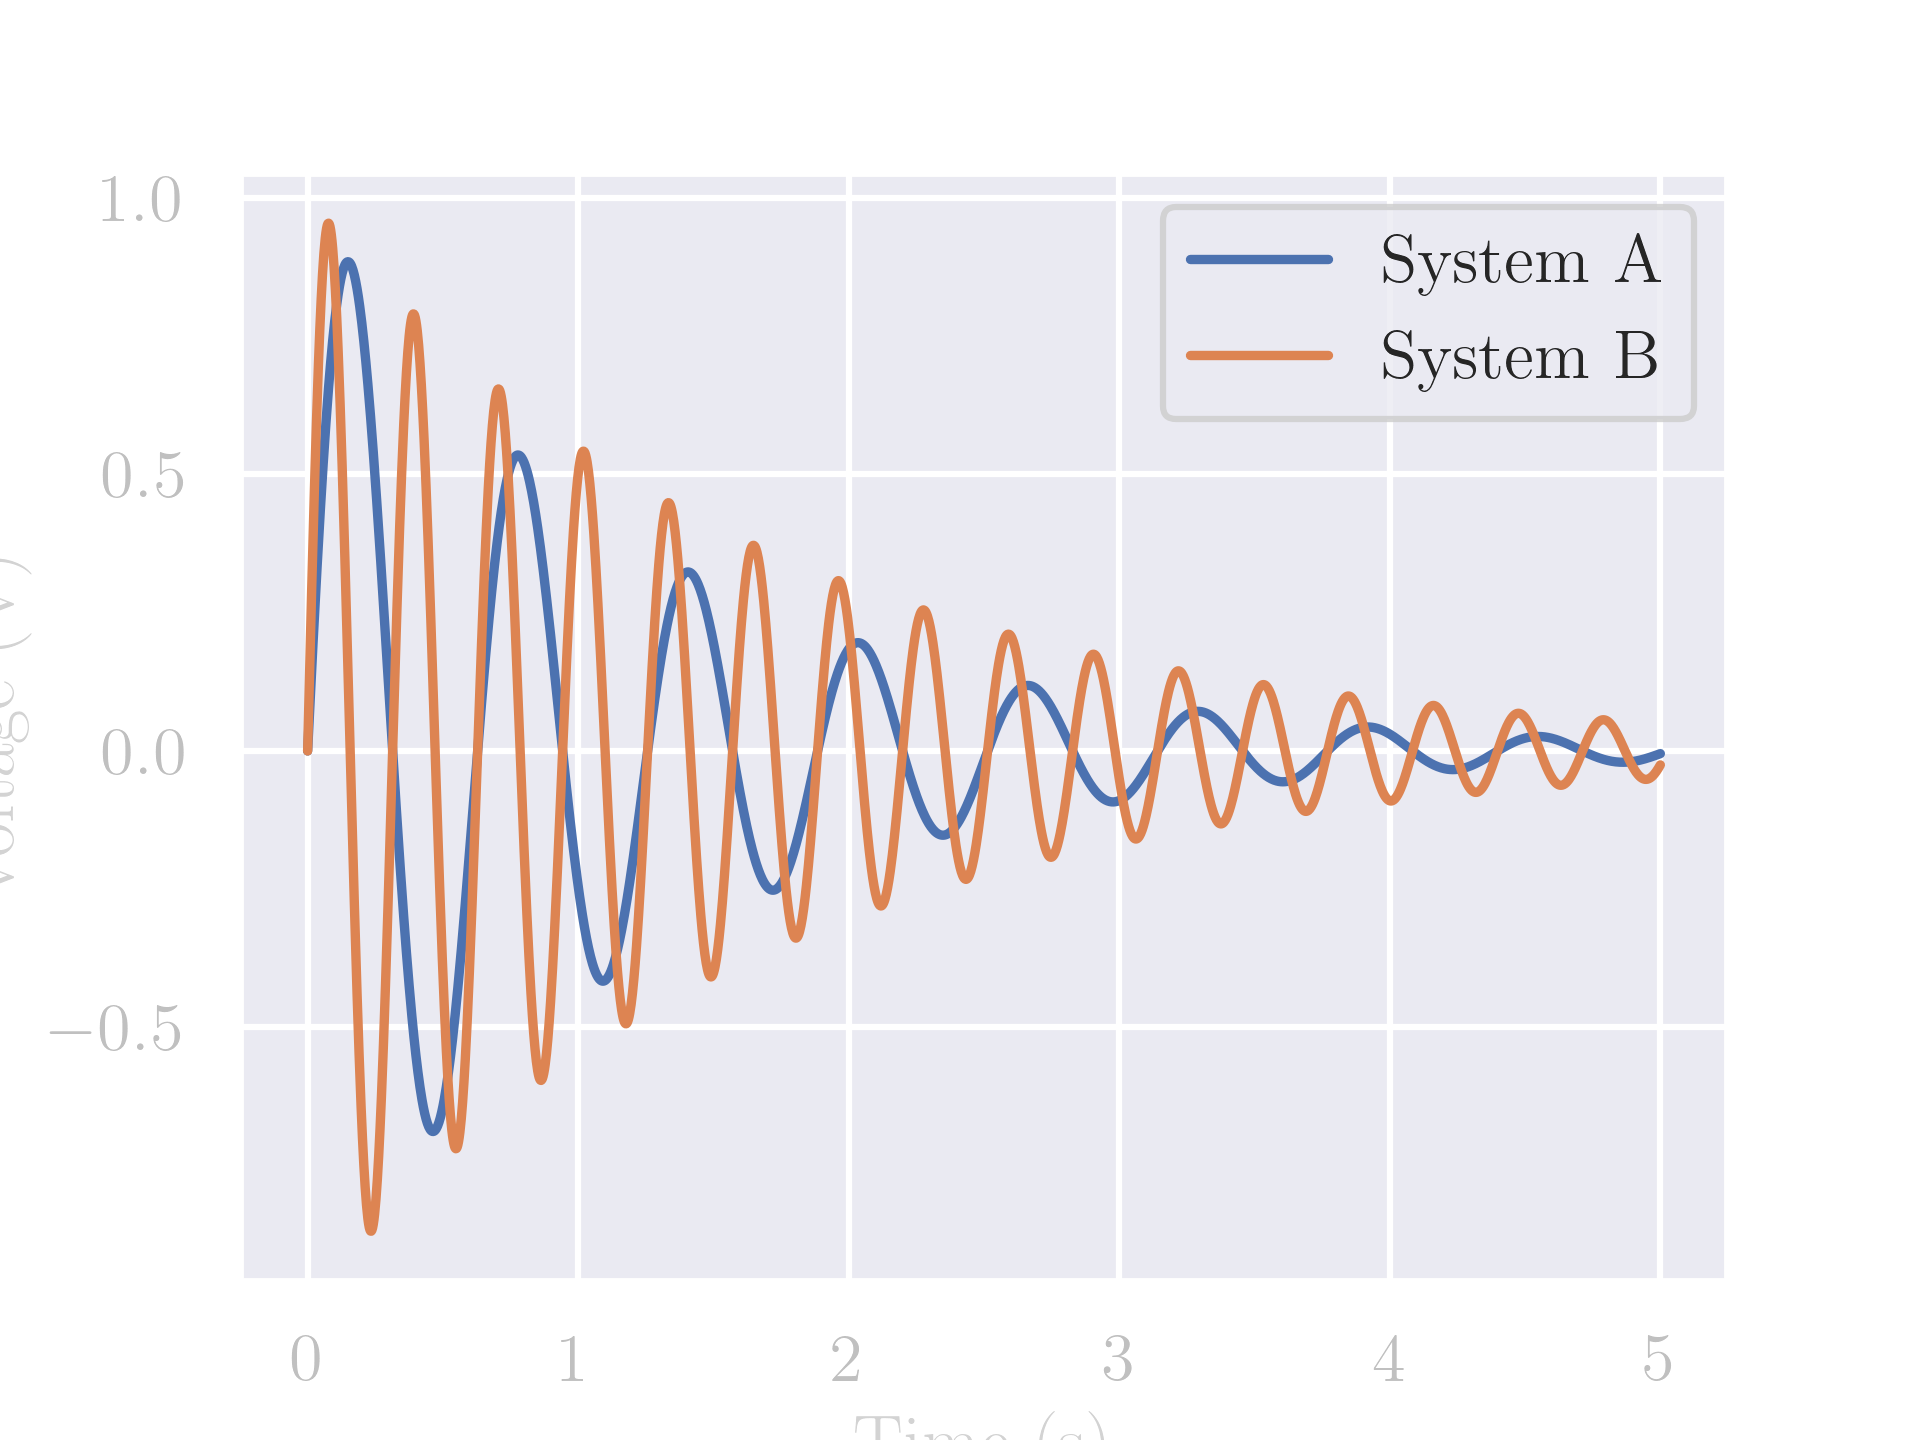
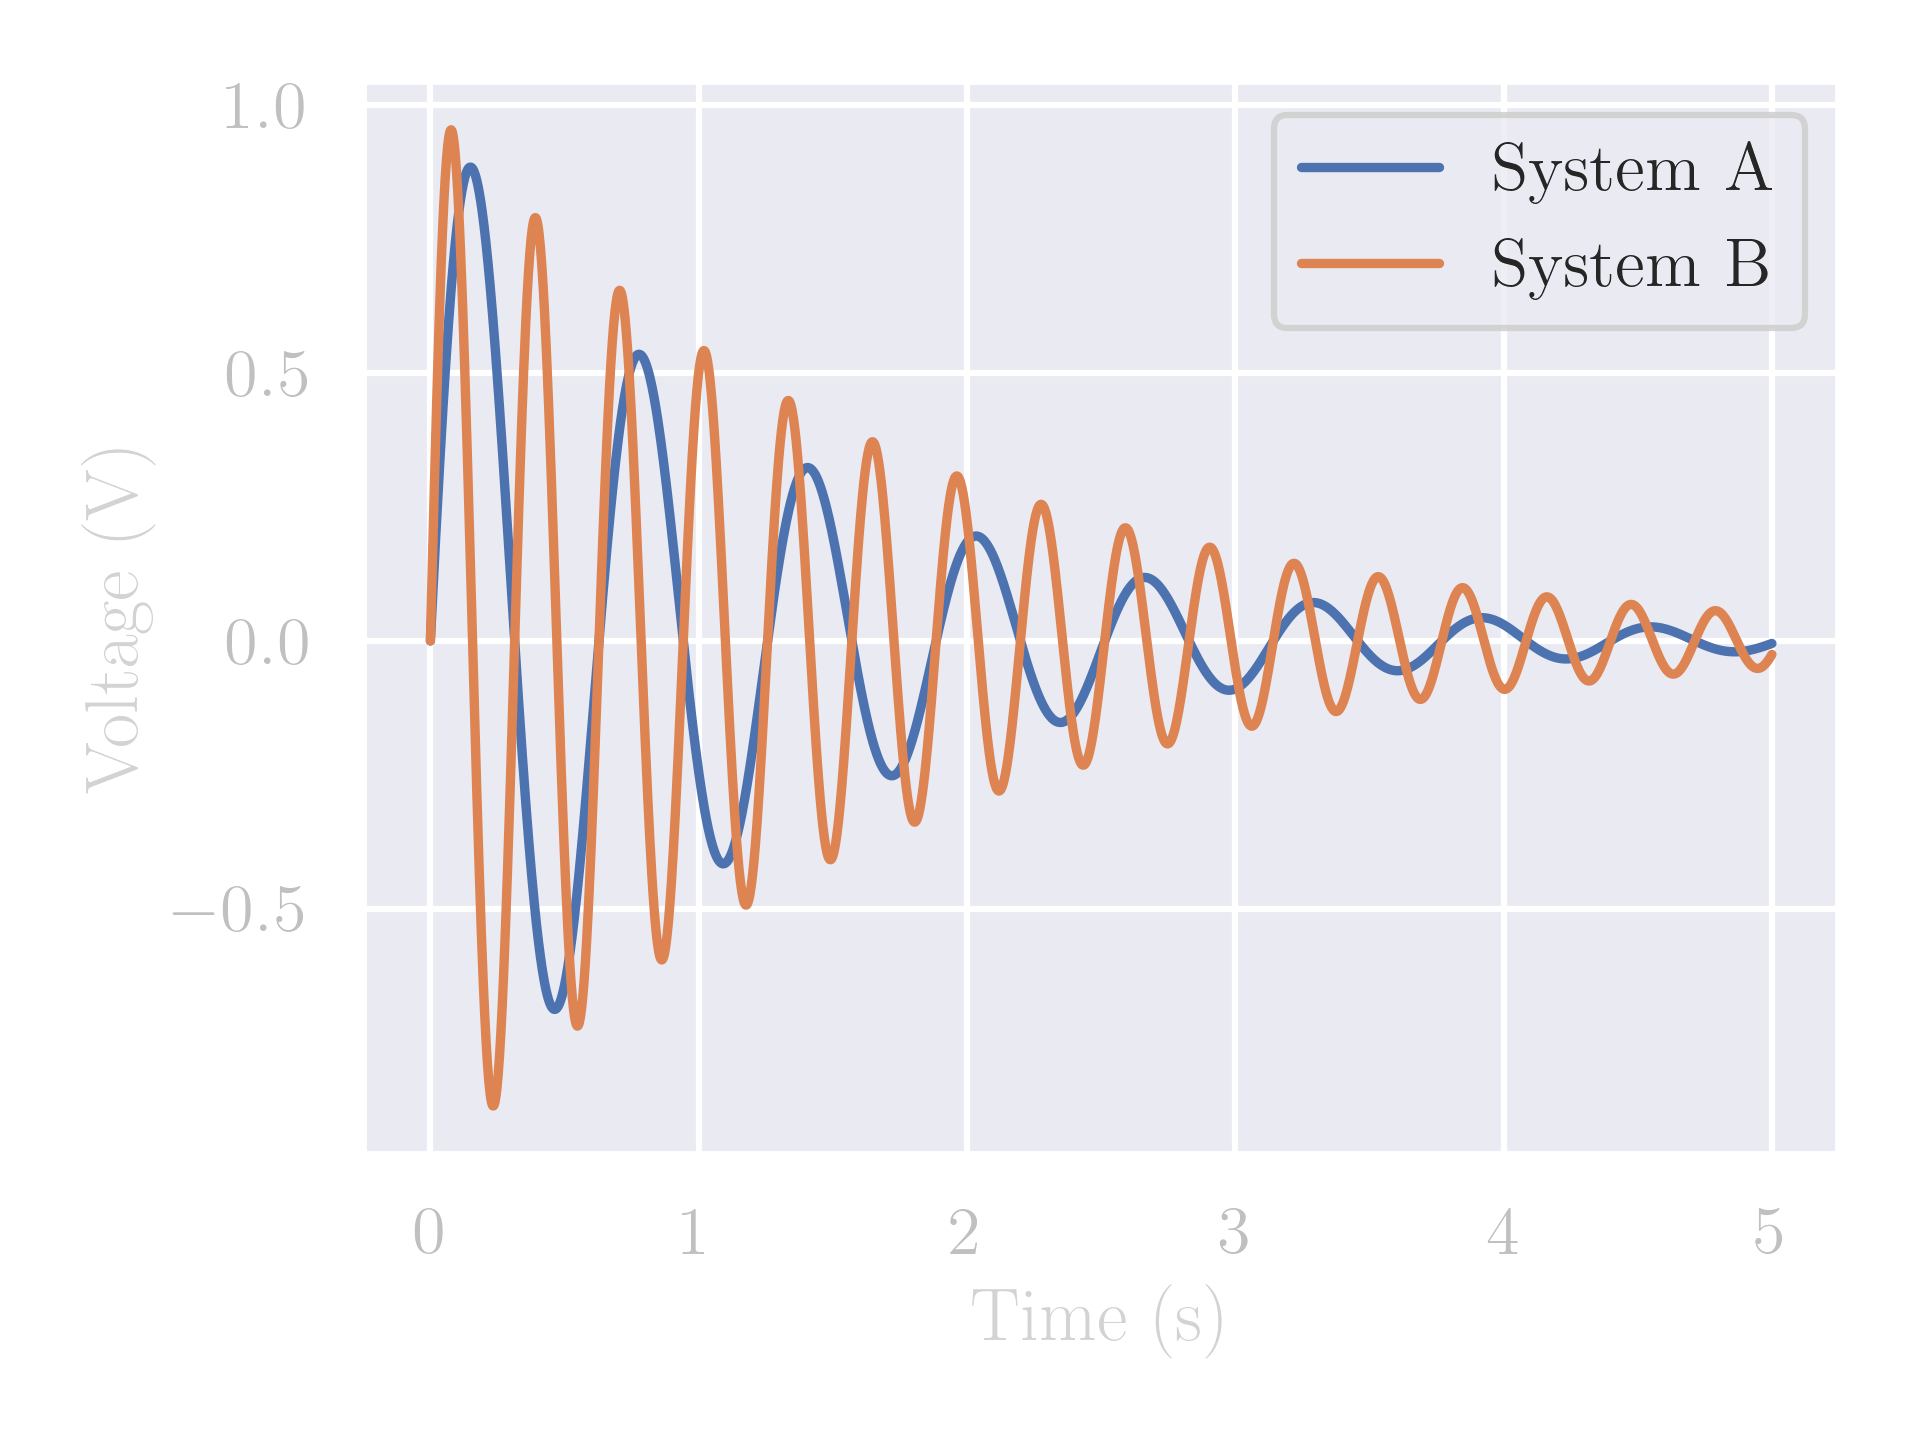
It is clear that the one for “talk” has higher font sizes, but it ends up being cropped. To best set this up, you can use the command fig.tight_layout() to properly center the figure and the labels so that they are not cropped:
sns.set_theme()
sns.set_context("talk")             # NEW
nice_fonts = {
    "text.usetex": True,
    "font.family": "serif",
    "font.serif" : "Times New Roman",
    "axes.labelcolor": "lightgray",
    "ytick.color" : "silver",
    "xtick.color" : "silver",
}
mpl.rcParams.update(nice_fonts)
fig, ax = plt.subplots(dpi=300)
ax.plot(t,x, label="System A")
ax.plot(t,y, label="System B")
ax.set_xlabel("Time (s)")
ax.set_ylabel("Voltage (V)")
ax.legend()
fig.tight_layout()                  # NEW
fig.savefig("step6b.png",facecolor="none")
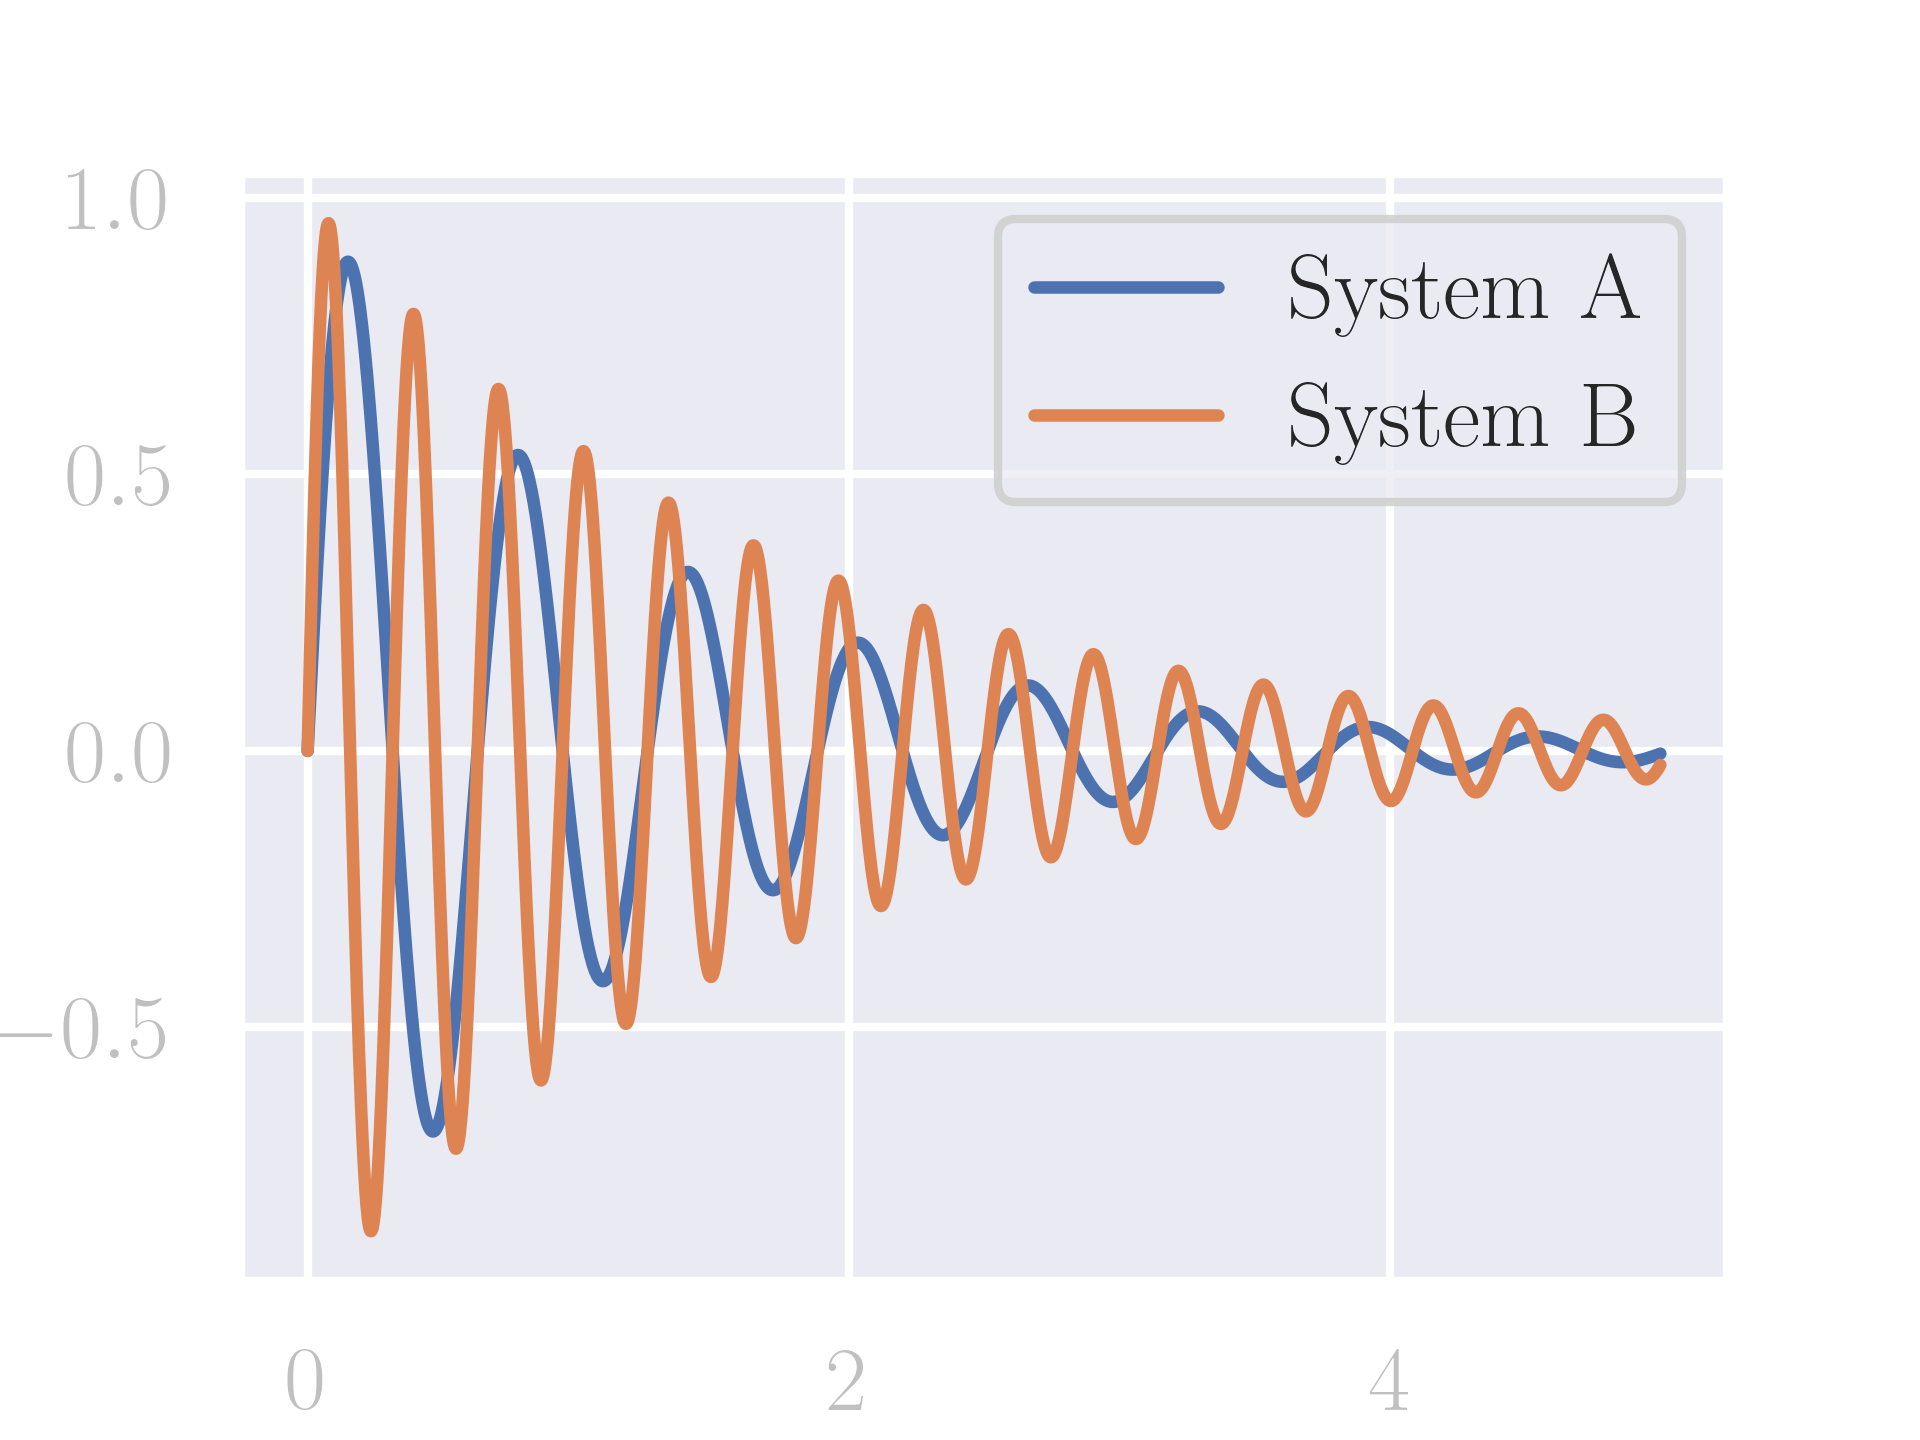
The same goes for the context of “poster”:
sns.set_theme()
sns.set_context("poster")
nice_fonts = {
    "text.usetex": True,
    "font.family": "serif",
    "font.serif" : "Times New Roman",
    "axes.labelcolor": "lightgray",
    "ytick.color" : "silver",
    "xtick.color" : "silver",
}
mpl.rcParams.update(nice_fonts)
fig, ax = plt.subplots(dpi=300)
ax.plot(t,x, label="System A")
ax.plot(t,y, label="System B")
ax.set_xlabel("Time (s)")
ax.set_ylabel("Voltage (V)")
ax.legend()
# fig.tight_layout()
fig.savefig("step7.png",facecolor="none")
sns.set_theme()
sns.set_context("poster")
nice_fonts = {
    "text.usetex": True,
    "font.family": "serif",
    "font.serif" : "Times New Roman",
    "axes.labelcolor": "lightgray",
    "ytick.color" : "silver",
    "xtick.color" : "silver",
}
mpl.rcParams.update(nice_fonts)
fig, ax = plt.subplots(dpi=300)
ax.plot(t,x, label="System A")
ax.plot(t,y, label="System B")
ax.set_xlabel("Time (s)")
ax.set_ylabel("Voltage (V)")
ax.legend()
fig.tight_layout()                  # WITH TIGHT LAYOUT
fig.savefig("step7b.png",facecolor="none")
Plotly
TODO