 This is a quick guide to put some LaTeX into your MATLAB plots
Step 0: Make Up Some Numbers
% GENERATE THE NUMBERS
x = 0:0.01:10;
y1 = exp(-0.25.*x).*sin(30.*x).*cos(2.*x);
y2 = sinc(x);
y3 = sin(2.*x);
y4 = exp(-0.75.*x);
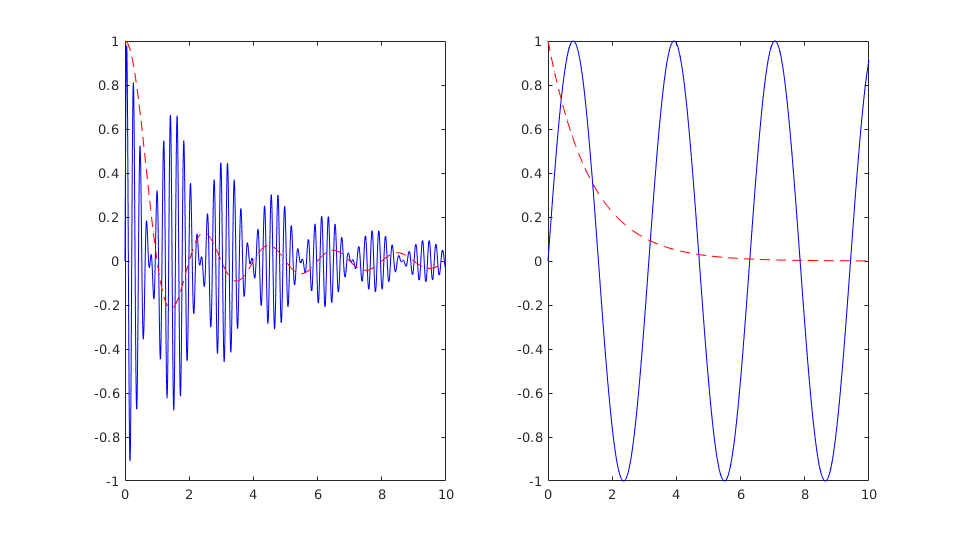
Step 1/2: Plot Them Up!
% PLOT THE NUMBERS
figure(1)
subplot(1,2,1)
plot(x,y1,'b-');
hold on
plot(x,y2,'r--');

subplot(1,2,2)
plot(x,y3,'b-');
hold on
plot(x,y4,'r--');
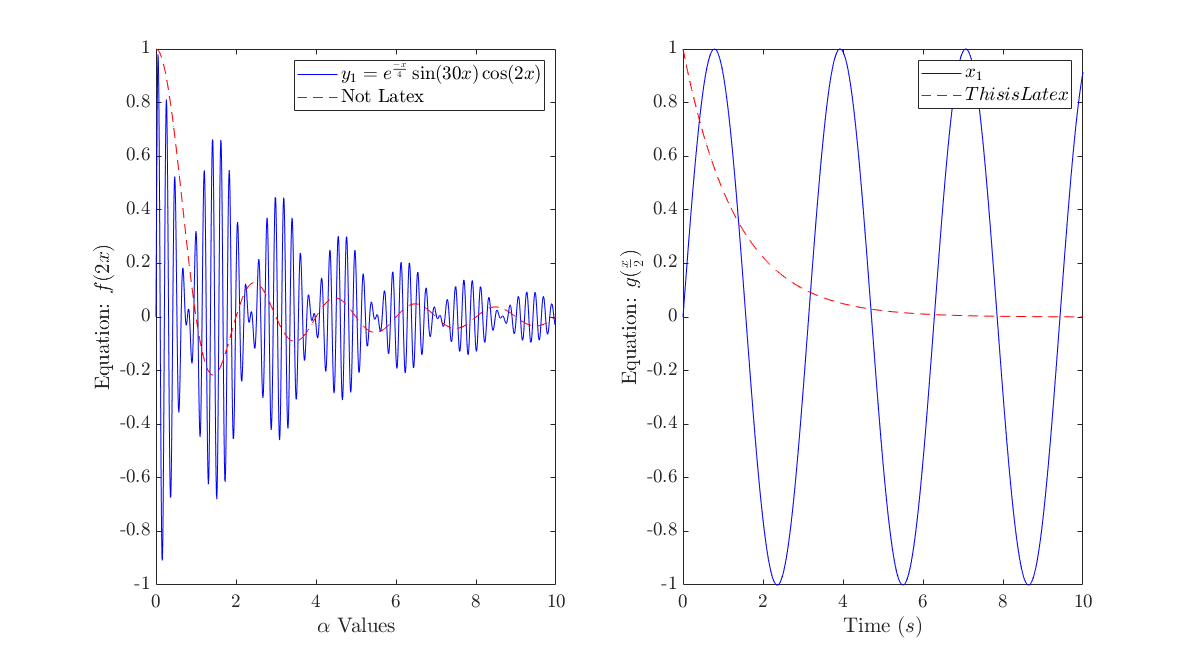
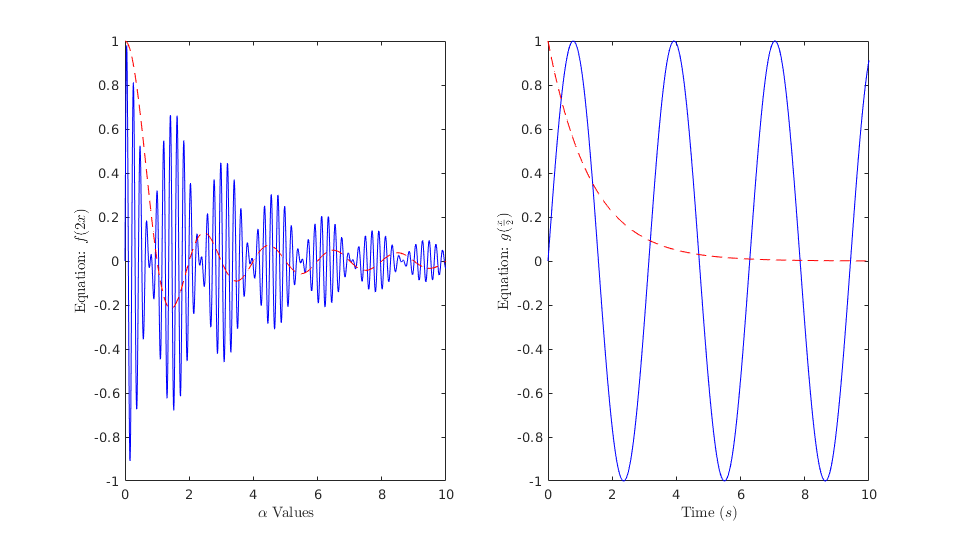
Step 1: LaTeX the X,Y Labels
% MAKE THE X-Y LABELS INTO LATEX
subplot(1,2,1)
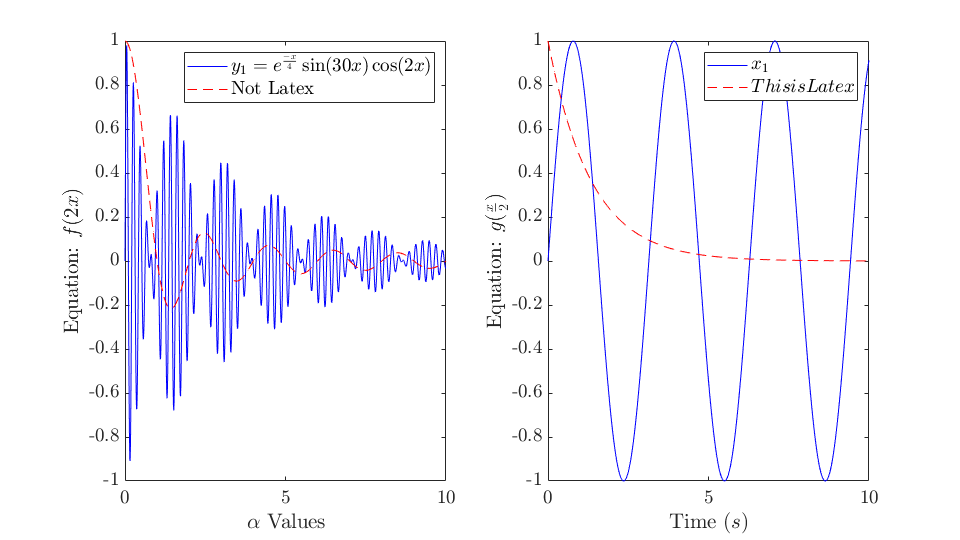
xlabel('$\alpha$ Values','Interpreter','latex')
ylabel('Equation: $f(2x)$','Interpreter','latex')
subplot(1,2,2)
xlabel('Time ($s$)','Interpreter','latex')
ylabel('Equation: $g(\frac{x}{2})$','Interpreter','latex')
Step 2: LaTeX the Legends
% SET LEGENDS AND MAKE THEM INTO LATEX
Legend = {'$y_1 = e^{\frac{-x}{4}} \sin(30x) \cos(2x)$','Not Latex'};

subplot(1,2,1);
leg1 = legend(Legend);
set(leg1,'Interpreter','latex');
set(gca,'TickLabelInterpreter','latex')

subplot(1,2,2);
leg2 = legend('$x_1$','$This is Latex$');
set(leg2,'Interpreter','latex');
set(gca,'TickLabelInterpreter','latex')
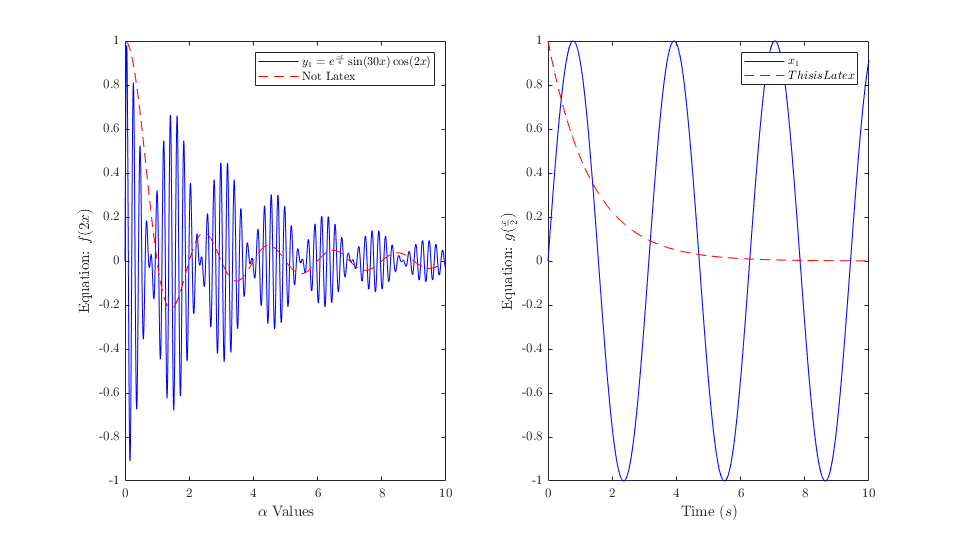
Step 3: Change the Font Sizes
% SET THE FONTSIZES
subplot(1,2,1)
set(gca,'FontSize',14);

subplot(1,2,2)
set(gca,'FontSize',14);

set(leg1,'FontSize',14);
set(leg2,'FontSize',14);
Step 4: Make it to Screen Size
% SET TO SCREEN SIZE
set(gcf, 'Position', get(0, 'Screensize'));
PREVIOUSLinux Terminal Cheatsheet